Re: RCU stall/SOFT-Lockup on 4.11.3/4.13.11 after multiple days uptime
From: Bruno PrÃmont
Date: Sun Nov 12 2017 - 13:30:24 EST
On Sun, 12 Nov 2017 18:29:06 Bruno PrÃmont wrote:
> On Sun, 12 November 2017 "Paul E. McKenney" wrote:
> > On Sun, Nov 12, 2017 at 12:09:28PM +0100, Bruno PrÃmont wrote:
> > > On Sat, 11 November 2017 "Paul E. McKenney" wrote:
> > > > On Sat, Nov 11, 2017 at 08:38:32PM +0100, Bruno PrÃmont wrote:
> > > > > Hi,
> > > > >
> > > > > On a single-CPU KVM-based virtual machine I'm suffering from RCU stall
> > > > > and soft-lockup. 4.10.x kernels run fine (4.10.12) but starting with
> > > > > 4.11.x (4.11.3, 4.13.11) I'm getting system freezes for no apparent
> > > > > reason.
> > > > >
> > > > > All info I have is following console dump (from 4.13.11):
> > > > > [526415.290012] INFO: rcu_sched self-detected stall on CPU
> > > > > [526415.290012] o0-...: (745847 ticks this GP) idle=ba2/2/0 softirq=37393463/37393463 fqs=0
> > > > > [526415.290012] o (t=745854 jiffies g=23779976 c=23779975 q=32)
> > > > > [526415.290012] rcu_sched kthread starved for 745854 jiffies! g23779976 c23779975 f0x0 RCU_GP_WAIT_FQS(3) ->state=0x0
> > > >
> > > > The above line says that the rcu_sched kthread asked to sleep for three
> > > > jiffies, but ended up sleeping for more than 745,854 jiffies.
> > > >
> > > > If your system does not let the RCU's kernel threads run, RCU cannot
> > > > help you much.
> > > >
> > > > The ->state of 0x0 indicates that the kthread is in fact runnable, but
> > > > did not get a chance to run. Was the system heavily loaded to the
> > > > point where you would expect a kthread to remain preempted for many
> > > > minutes?
> > > >
> > > > I am guessing that the answer is no, given that CPU 0 is actually idle
> > > > (idle=ba2/2/0). Seems unlikely, but I have to ask: Did you bind the
> > > > kthread to a specific CPU?
> > >
> > > The system should be lightly loaded (about 5-10% CPU usage on average), so
> > > plenty of time for RCU to do its work.
> > >
> > > I didn't bind processes (be it userspace process or kthread) to a specific
> > > CPU, thus it's all auto-configured.
> > >
> > > I guess the question then is what is the system busy with or waiting for
> > > that prevents RCU to get its work done...
> > > Shouldn't the watchdog print a trace of where CPU#0 is stuck? If so I might need
> > > to check at which log level and make sure that loglevel reaches console.
> > > Nothing did hit the disk though.
> >
> > Do you have a high-speed interface to capture and store console output?
> > (As in something that can handle, say, 50MB in a reasonable period of
> > time.)
>
> The only option I could have is netconsole, in the hope it does not cause
> issues by itself!
>
> Other than that I have a poor man's web-VNC kind of view on VGA-sized
> text console, which is slow and small (it's a virtual server at a hosting
> company).
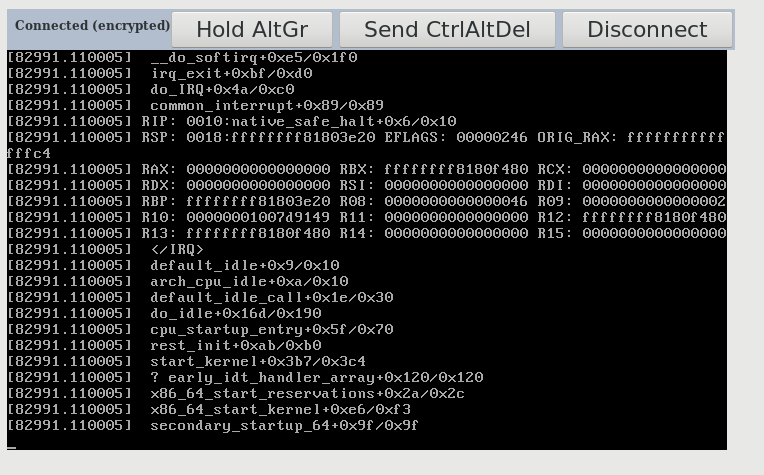
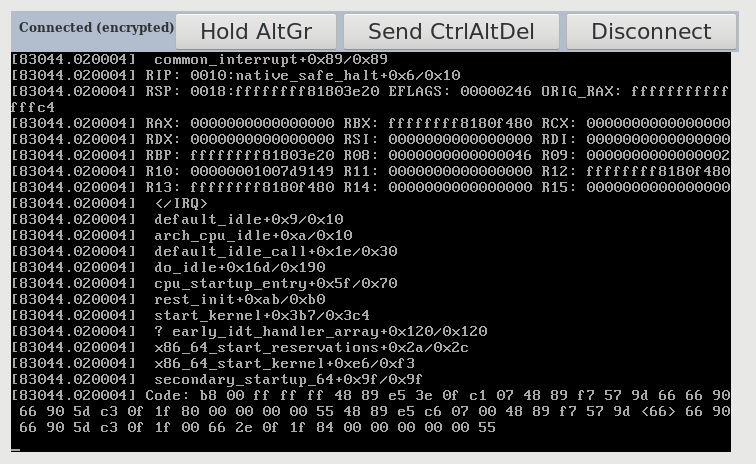
Got a new stall "caught early" with some partial trace output. System
had been running for nearly 24 hours though did have some IO load (rsync
over SSH of data mountpoint) at the time of stall.
Attaching the screen-shotted output which might help pointing in some
direction.
This time there is a stack-trace with some possibly useful content
(I did tune console log level to include everything `dmesg -n 8`)
It seems to point to native_safe_halt+0x6/0x10 with some interrupt
interaction. Unfortunately one of the trace halves was never rendered on
the web-VNC console...
Partially transcribed trace:
__do_softirq+0xe5/0x1f0
irq_exit+0xbf/0xd0
do_IRQ+0x4a/0xc0
comon_interrupt+0x89/0x89
RIP: 0010:native_safe_halt+0x6/0x10
... (register dump)
</IRQ>
default_idle+0x9/0x10
arch_cup_idle+0xa/0x10
default_idle_Call+0x1e/0x30
do_idle+0x16d/0x190
cpu_startup_entry+0x5f/0x70
rest_init+0xab/0xb0
start_kernel+0x3b7/0x3c4
? early_idt_handler_array+0x120/0x120
x86_64_start_reservations+0x2/0x2c
x86_64_start_kernel+0xe6/0xf3
secondary_startup_64+0x9f/0x9f
Thanks,
Bruno
> > Thanx, Paul
> >
> > > Thanks,
> > > Bruno
> > >
> > > > Thanx, Paul
> > > >
> > > > > [526440.020015] watchdog: BUG: soft lockup - CPU#0 stuck for 22s! [swapper/0:0]
> > > > > [526468.020005] watchdog: BUG: soft lockup - CPU#0 stuck for 22s! [swapper/0:0]
> > > > > [526478.320009] INFO: rcu_sched self-detected stall on CPU
> > > > > [526478.320009] o0-...: (752143 ticks this GP) idle=ba2/2/0 softirq=37393463/37393463 fqs=0
> > > > > [526478.320009] o (t=752157 jiffies g=23779976 c=23779975 q=32)
> > > > > [526478.320009] rcu_sched kthread starved for 752157 jiffies! g23779976 c23779975 f0x0 RCU_GP_WAIT_FQS(3) ->state=0x0
> > > > > [526504.020016] watchdog: BUG: soft lockup - CPU#0 stuck for 22s! [swapper/0:0]
> > > > > [526532.020007] watchdog: BUG: soft lockup - CPU#0 stuck for 22s! [swapper/0:0]
> > > > > ...
> > > > >
> > > > > Attached is kernel config (4.13.11).
> > > > >
> > > > >
> > > > > The output obtained with 4.11.3 was:
> > > > > [ 280.680010] INFO: rcu_sched self-detected stall on CPU
> > > > > [ 280.680021] o0-...: (27312 ticks this GP) dile=b11/2/0 softirq=6119/6119 fqs=0
> > > > > [ 280.680021] o (t=27312 jiffies g=441 c=440 q=0)
> > > > > [ 280.680021] rcu_sched_kthread starved for 27312 jiffies! g441 c440 f0x0 RCU_GP_WAIT_FQS(3) ->state=0x0
> > > > > ...
> > > > >
> > > > >
> > > > > As it's a remote VM for which I don't have access to the host I have little
> > > > > options for further digging (can't trigger sysrq's).
> > > > >
> > > > >
> > > > > Same kernel (4.13.11) seems to be running just fine on another KVM-base VM that
> > > > > has two CPUs.
> > > > >
> > > > >
> > > > > Does it ring a bell or is there some info that might be of any use,
> > > > > assuming I can obtain it?
> > > > >
> > > > > Bruno
> > > >
> > > >
> > >
> >
Attachment:
trace1.png
Description: PNG image
Attachment:
trace2.png
Description: PNG image