RE: [PATCH v3 00/21] x86/resctrl: Make resctrl_arch_rmid_read() return values in bytes
From: Cristian Marussi
Date: Tue Mar 15 2022 - 08:11:00 EST
Hi James,
I tested this on an Intel(R) Xeon(R) Gold 5120T trying to compare gathered
resctrl monitor data with and without your series and see if results
were consistent.
I started from this paper [0] from Intel itself for my basic setup with
some minor variations: basically, using the attached test_monitors.sh
my test setup is as follows:
- a cpuset shield is created upfront isolating all the cpus belonging
to node1 (14-27,42-55)
- 2 resctrl CoS are created:
+ 1 process (tar on a big file) act as a LC LatencyCritical actor
and is run on one of the shielded CPUs with taskset (48)
+ other 3 processes instead runs stress-ng, supposedly acting as
BE BestEffort noisy neighbours and are pinned to other 3 distinct
cpus (49,50,51)
The script then triggers 4 different runs of the above crowd with different
cache allocation masks setup in lc/be CoS schemata for node1: ranging
basically from no dedicated allocation (7ff 7ff) to a cache allocation
highly unbalanced in favour of the LC task (7fe 001).
While doing that I collect in background (and out of node1 processors) all
the mon_data from the lc_cos group every 100ms and dump those in a file one
for each cache allocation mask. (mondata_LC_7f0_00f.txt etc)
I tested first against a v5.17-rc1 mainline without your series (named as
5.17.0-rc1-mainline in the results) and then again with your series on top
(named as 5.17.0-rc1-00021-g21c69a5706a5). Got your series from [1].
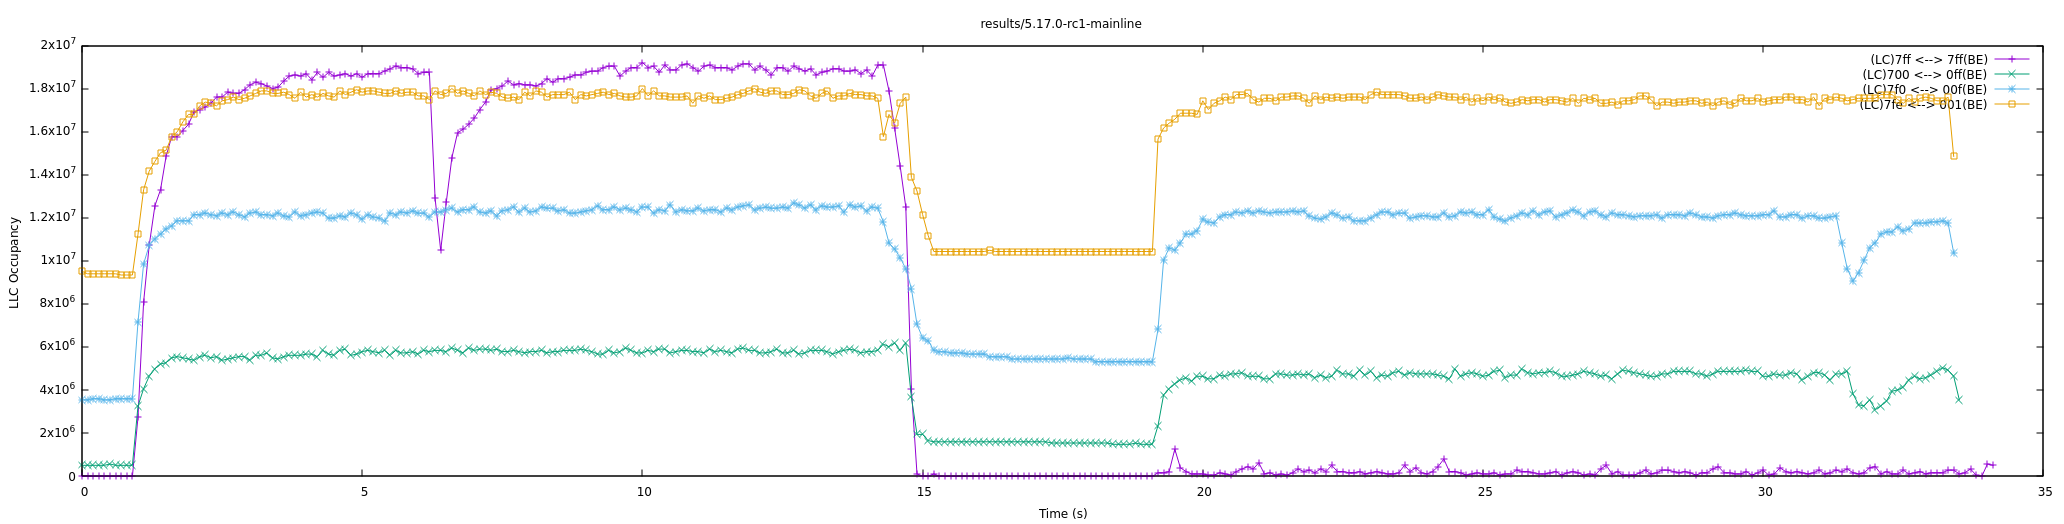
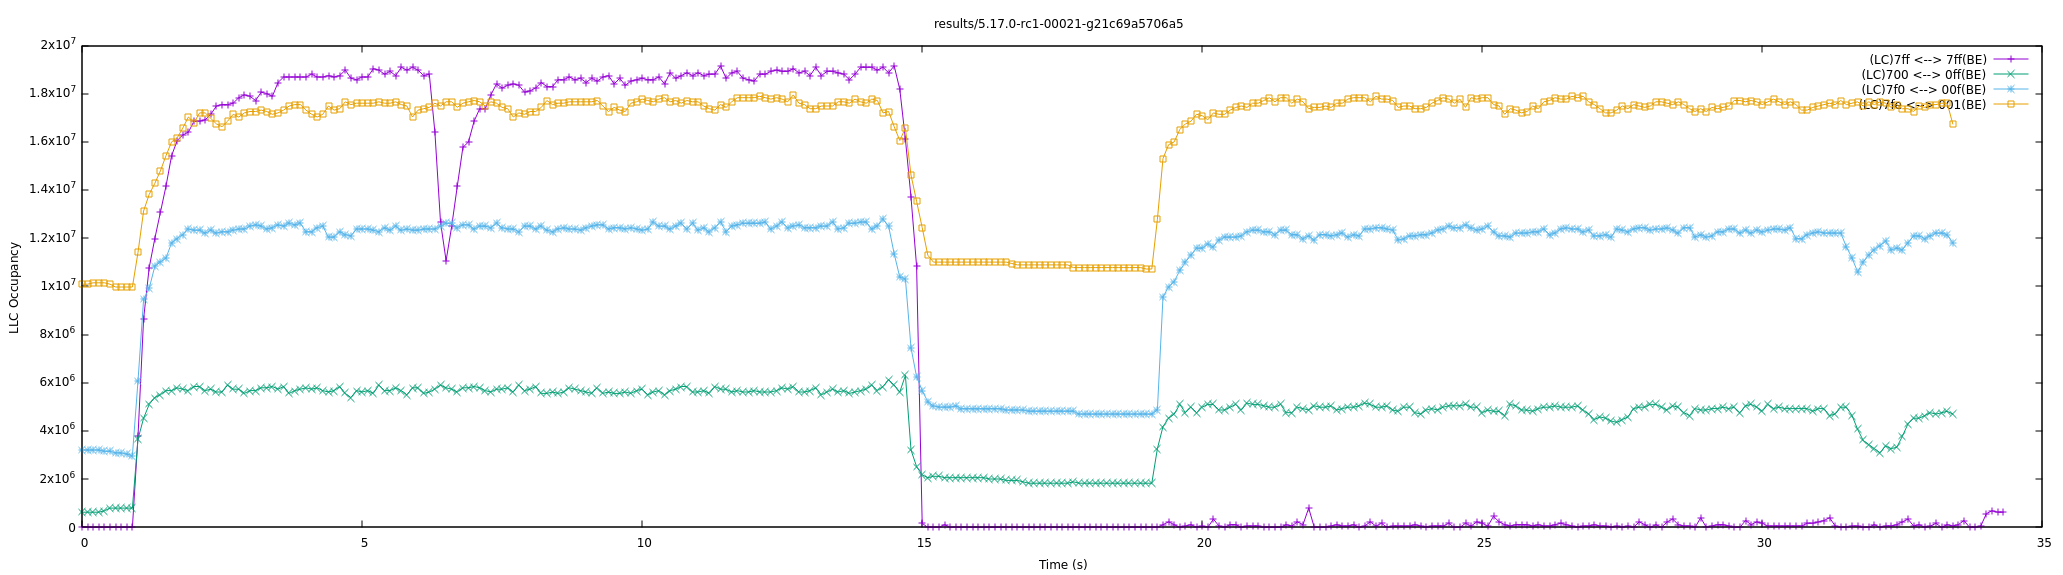
Then I used gnuplot to see what was the 'profile' of this data with and
without your series by plotting the LC process llc_occupancy data against
time for each one of the runs with the differerent cache allocated.
(each colored graphs represent a different run with a different
cache allocation as reported)
Note that during each run:
- at first the LC process is run without any noisy BEs
- then BEs neighbours are spawned and let to settle for 5s
- finally LC is run again while BEs are making a mess in bg
As a consequence in the plotted graphs, you can see a clear break between
the first part of the run and the last one with BEs.
Looking at the graphs it seems to me that the resctrl counters with and
without you series report a highly similar data profile, as expected
(and hoped :D).
I attach as references:
- a tarball of the raw data (test_mon_data.gz)
- the test_monitors.sh script (not nice but working)
- draw_resctrl.gp gnuplot script
- two PNG of the LC llc_occupancy graphs (all cachemasks runs)
- with your series: LC_llc_occupancy_5.17.0-rc1-00021-g21c69a5706a5.png
- without your series: LC_llc_occupancy_5.17.0-rc1-mainline.png
Gnuplot is run as:
gnuplot -e "filedir='results/5.17.0-rc1-00021-g21c69a5706a5" draw_resctrl.gp
Hope this helps...
Thanks,
Cristian
[0] https://www.intel.com/content/www/us/en/developer/articles/technical/use-intel-resource-director-technology-to-allocate-last-level-cache-llc.html
[1] git://git.kernel.org/pub/scm/linux/kernel/git/morse/linux.git mpam/resctrl_monitors_in_bytes/v3
#!/usr/bin/gnuplot --persist
set title filedir
set xlabel "Time (s)"
set ylabel "LLC Occupancy"
cd filedir
plot './mondata_LC_7ff_7ff.txt' using 1:2 t "(LC)7ff <--> 7ff(BE)" with linespoint,\
'./mondata_LC_700_0ff.txt' using 1:2 t "(LC)700 <--> 0ff(BE)" with linespoint,\
'./mondata_LC_7f0_00f.txt' using 1:2 t "(LC)7f0 <--> 00f(BE)" with linespoint,\
'./mondata_LC_7fe_001.txt' using 1:2 t "(LC)7fe <--> 001(BE)" with linespoint
pause -1
Attachment:
test_mon_data.gz
Description: application/gzip
Attachment:
test_monitors.sh
Description: Bourne shell script
Attachment:
LC_llc_occupancy_5.17.0-rc1-mainline.png
Description: PNG image
Attachment:
LC_llc_occupancy_5.17.0-rc1-00021-g21c69a5706a5.png
Description: PNG image