Re: [RFC][PATCH 0/7] sched: select_idle_siblings rewrite
From: Chris Mason
Date: Wed May 25 2016 - 10:52:32 EST
On Mon, May 09, 2016 at 12:48:07PM +0200, Peter Zijlstra wrote:
> Hai,
>
> here be a semi coherent patch series for the recent select_idle_siblings()
> tinkering. Happy benchmarking..
This took a while, mostly because my original schbench showed your
patches were just as fast as our internal patch, but our production
benchmark showed a 5-10% regression. My theory was just that schbench
wasn't fine grained enough, and the load would stop before the
regression kicked in.
So, I added a -R (--rps) mode to schbench. The goal was a single
command line that ran through an increasing workload and captured the 5%
performance regression from Peter's patch.
The new code is in schbench git:
git://git.kernel.org/pub/scm/linux/kernel/git/mason/schbench.git
In RPS mode each messenger thread queues up requests for the workers.
It records the latency between when the request was queued to when
it was completed. Since the request is just spinning for a specific
amount of wall time, the spintime is subtracted before printing.
This means the printed number is our overhead. It could be scheduling
delay, or a context switch in the middle of processing the request.
To help normalize things, I also calculate and print this latency
divided by the spin time. This lets me figure out when to stop the auto
mode, and I found it a faster way to compare results from two runs.
Longer runs give very consistent results, except when you first turn
AVG_CPU back on. It took me a while to figure out Peter's math was
screwing with me, and each run would be a little slower than the last
until it stabilized.
Ok, row for results. My test boxes have two sockets, 24 cores per
socket. So I'm running with two messenger threads and 23 workers per
messenger. -R is the requests per second rate, -R 1 means: guess a good
starting point based on the cputime.
You can pass -R <number>, and you can use -R without -a if you want to
focus on a specific spot.
# NO_AVG_CPU
# ./schbench -t 23 -R 1 -m 2 -r 180 -a
autobench rps 897
rps: 897.08 p95 (usec) 50 p99 (usec) 56 p95/cputime 0.17% p99/cputime 0.19%
rps: 926.88 p95 (usec) 50 p99 (usec) 56 p95/cputime 0.17% p99/cputime 0.19%
rps: 956.77 p95 (usec) 50 p99 (usec) 55 p95/cputime 0.17% p99/cputime 0.18%
rps: 986.80 p95 (usec) 45 p99 (usec) 51 p95/cputime 0.15% p99/cputime 0.17%
rps: 1047.09 p95 (usec) 1362 p99 (usec) 1386 p95/cputime 4.54% p99/cputime 4.62%
rps: 1076.93 p95 (usec) 2156 p99 (usec) 2180 p95/cputime 7.19% p99/cputime 7.27%
rps: 1106.56 p95 (usec) 2916 p99 (usec) 3324 p95/cputime 9.72% p99/cputime 11.08%
rps: 1136.57 p95 (usec) 3620 p99 (usec) 3644 p95/cputime 12.07% p99/cputime 12.15%
rps: 1196.22 p95 (usec) 4936 p99 (usec) 4952 p95/cputime 16.45% p99/cputime 16.51%
rps: 1226.04 p95 (usec) 5544 p99 (usec) 5576 p95/cputime 18.48% p99/cputime 18.59%
rps: 1255.90 p95 (usec) 6120 p99 (usec) 6152 p95/cputime 20.40% p99/cputime 20.51%
rps: 1315.50 p95 (usec) 7208 p99 (usec) 7240 p95/cputime 24.03% p99/cputime 24.13%
rps: 1345.27 p95 (usec) 7720 p99 (usec) 7736 p95/cputime 25.73% p99/cputime 25.79%
rps: 1404.84 p95 (usec) 8656 p99 (usec) 8688 p95/cputime 28.85% p99/cputime 28.96%
rps: 1434.59 p95 (usec) 9104 p99 (usec) 9136 p95/cputime 30.35% p99/cputime 30.45%
rps: 1464.29 p95 (usec) 9520 p99 (usec) 9552 p95/cputime 31.73% p99/cputime 31.84%
rps: 1515.09 p95 (usec) 15152 p99 (usec) 16336 p95/cputime 50.51% p99/cputime 54.45%
rps: 1532.98 p95 (usec) 1722368 p99 (usec) 1800192 p95/cputime 5741.23% p99/cputime 6000.64%
# AVG_CPU
# ./schbench -t 23 -R 1 -m 2 -r 180 -a
autobench rps 897
rps: 897.15 p95 (usec) 49 p99 (usec) 55 p95/cputime 0.16% p99/cputime 0.18%
rps: 926.94 p95 (usec) 50 p99 (usec) 56 p95/cputime 0.17% p99/cputime 0.19%
rps: 956.78 p95 (usec) 50 p99 (usec) 55 p95/cputime 0.17% p99/cputime 0.18%
rps: 986.79 p95 (usec) 45 p99 (usec) 51 p95/cputime 0.15% p99/cputime 0.17%
rps: 1044.92 p95 (usec) 1374 p99 (usec) 1998 p95/cputime 4.58% p99/cputime 6.66%
rps: 1074.93 p95 (usec) 2164 p99 (usec) 2636 p95/cputime 7.21% p99/cputime 8.79%
rps: 1103.85 p95 (usec) 2916 p99 (usec) 3404 p95/cputime 9.72% p99/cputime 11.35%
rps: 1133.10 p95 (usec) 3628 p99 (usec) 4136 p95/cputime 12.09% p99/cputime 13.79%
rps: 1193.01 p95 (usec) 4936 p99 (usec) 5320 p95/cputime 16.45% p99/cputime 17.73%
rps: 1222.18 p95 (usec) 5544 p99 (usec) 5976 p95/cputime 18.48% p99/cputime 19.92%
rps: 1251.14 p95 (usec) 6136 p99 (usec) 6504 p95/cputime 20.45% p99/cputime 21.68%
rps: 1309.63 p95 (usec) 7224 p99 (usec) 7752 p95/cputime 24.08% p99/cputime 25.84%
rps: 1336.49 p95 (usec) 7720 p99 (usec) 8496 p95/cputime 25.73% p99/cputime 28.32%
rps: 1398.47 p95 (usec) 8656 p99 (usec) 9200 p95/cputime 28.85% p99/cputime 30.67%
rps: 1429.66 p95 (usec) 9104 p99 (usec) 9488 p95/cputime 30.35% p99/cputime 31.63%
rps: 1459.88 p95 (usec) 9520 p99 (usec) 9968 p95/cputime 31.73% p99/cputime 33.23%
rps: 1487.82 p95 (usec) 9936 p99 (usec) 11024 p95/cputime 33.12% p99/cputime 36.75%
rps: 1532.85 p95 (usec) 1550336 p99 (usec) 1628160 p95/cputime 5167.79% p99/cputime 5427.20%
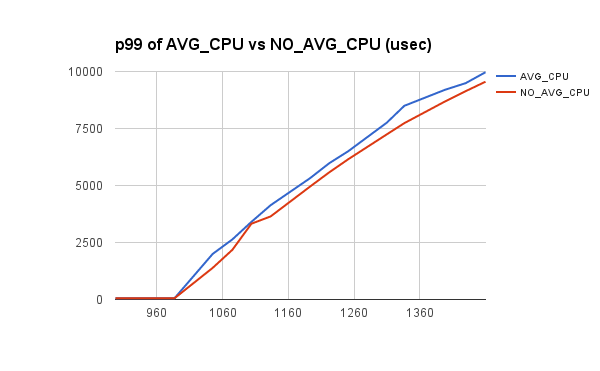
Jumping into the sweet spot in the run:
NO_AVG_CPU rps: 1345.27 p95 (usec) 7720 p99 (usec) 7736 p95/cputime 25.73% p99/cputime 25.79%
AVG_CPU rps: 1336.49 p95 (usec) 7720 p99 (usec) 8496 p95/cputime 25.73% p99/cputime 28.32%
p95 times are fine, but p99 shows a ~9% difference. Running the
same workloads on my patch gives the same numbers as NO_AVG_CPU. I've
attached a png to help show the difference between NO_AVG_CPU and
AVG_CPU.
Auto mode ends when the p99 ratios go crazy. I wouldn't put too much
value in the last few lines, the machine is so saturated that anything
could be happening.
Hope this helps, I'm going to keep tweaking schbench as we compare it
with the production runs here.
-chris
Attachment:
p99.png
Description: Binary data